Analytics
On Analytics, generate, view, and manage different reports to obtain the required information about your Organization's orders, Candidates, invoices, and other data. You can access the needed report from the left menu of the Analytics tab. Hide the imageSee the image
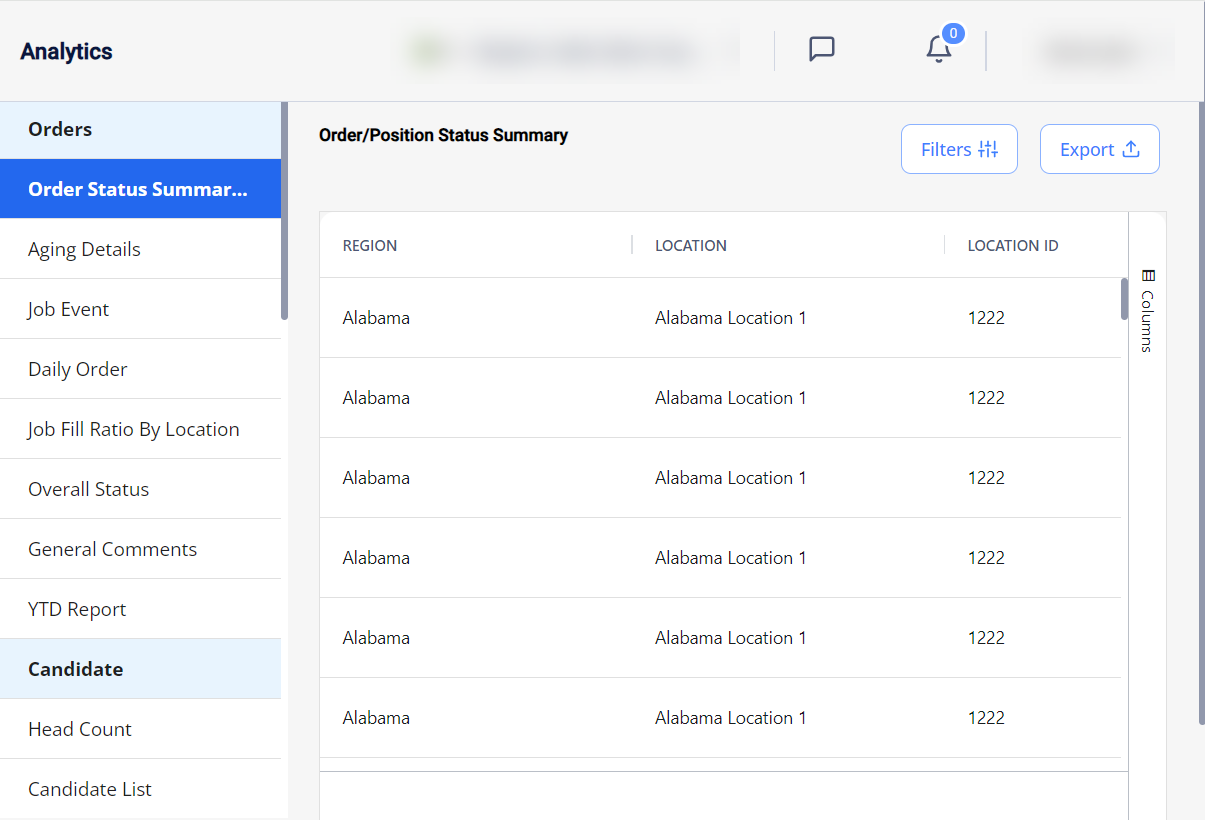
To pull the needed data for your report, in the upper right of the page, use the Filter option and make the required selections.
- For most of the reports, a specific default filtering is used and indicated on top of the page.
Following are all the reports grouped by the data they present:
- The reports you may access depend on your permissions.
Orders
- Order Status Summary: shows your Organization's orders and the status summary of their related positions based on the applied filtering.
- Job Fill Ratio By Agency: shows the percentage of successfully filled positions by the selected Agency(ies) within the specified date range, based on the applied filtering. The report considers LTA and Contract to Perm orders, as well as Cancelled (but not Rejected) Candidates.
- Re-Order Status: shows information about your Organization's re-orders based on the applied filtering. The report considers re-orders with the Open, In Progress, and Filled statuses based on the specified re-order date.
- Aging Details: shows details about the current and overdue invoices within the specific aging group(s) based on the applied filtering.
To view the Aging Summary, select this option from the Go to dropdown menu on the right of the page. Hide the imageSee the image.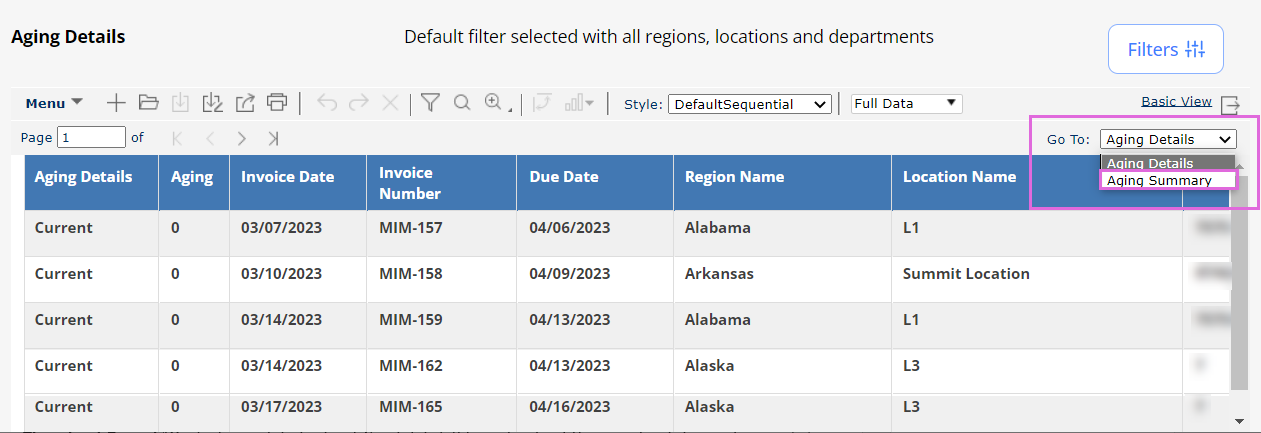
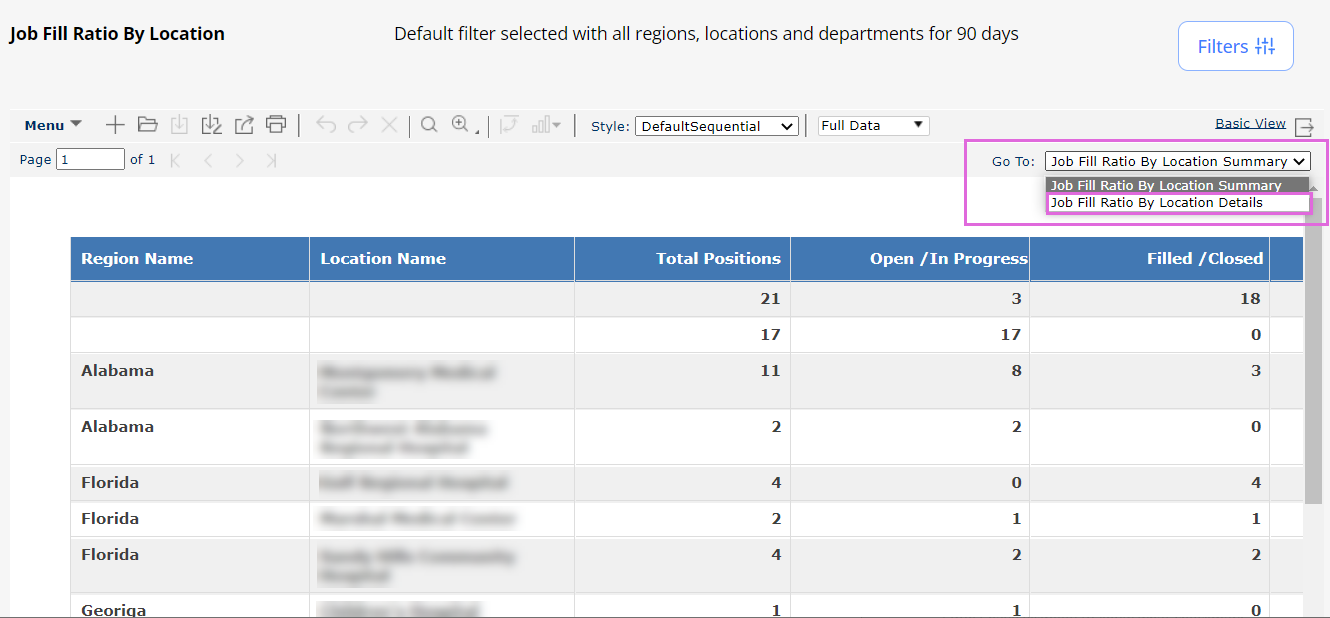
- Job Fill Ratio By Location: shows the percentage of successfully filled positions by the selected location(s) within the specified date range, based on the applied filtering. To view more details on this report, from the Go To dropdown menu, select the Job Fill Ratio By Location Details option. Hide the imageSee the image.
- Overall Status: shows the Start and End Dates of order(s), their positions, and respective Candidates within the specified date range based on the applied filtering.
- General Comments: shows all the internal and external comments left by your Organization users and the associated Agency(ies) users on order, Candidate, and timesheet levels, based on the applied filtering.
Candidates
- Head Count: shows a high-level summary of positions in different statuses as of the day the report is published.
- Clock ID: shows the availability of the Candidates' Clock ID value based on the applied filtering. The report considers LTA and Contract to Perm orders, and re-orders.
- Candidate List: shows the list of Candidates from specified Agency(ies) and their details based on the applied filtering. You can also filter the list by a specific Candidate or skill and select to show only the Candidates in Complete or Active statuses for the Agency(ies).
- Candidate Status: shows the list of Candidates with specific statuses and the orders they are associated with for the specified date range based on the applied filtering.
- Candidate Journey: shows details about the Candidates’ journey on a specific order based on the applied filtering, including:
- How quickly a Candidate is applied to an order after its distribution.
- How quickly your Organization completes each step of a Candidate’s hiring journey.
- Actual Start Date and Actual End Date will reflect updates from the Candidate screen on a position.
Filter for this report is based on the current Order Dates.
For the columns displaying the number of days between the different Candidate statuses, the first row in the table provides the average number of days for all Candidates, while all the next rows provide this number for each specific Candidate. Hide the imageSee the image.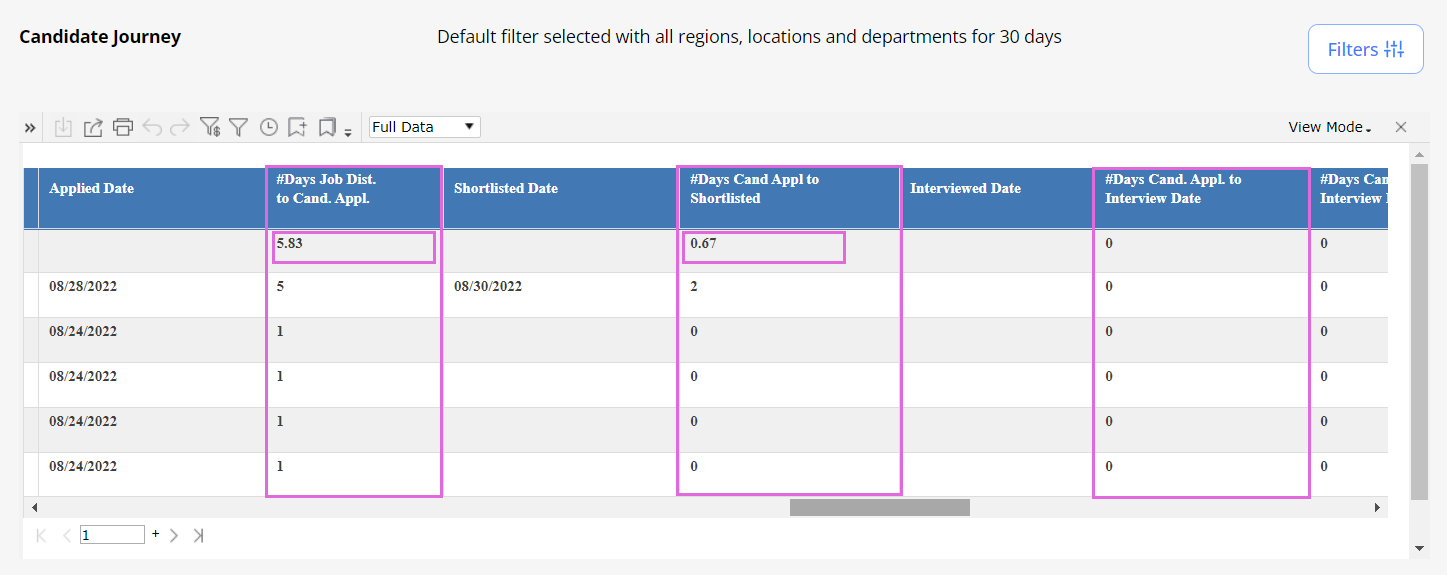
- Actual Start Date and Actual End Date will reflect updates from the Candidate screen on a position.
- Position Summary: shows positions' details of Accepted, Onboard, Offboard, and Cancelled Candidates based on the applied filtering. This report allows you to check if a specific position was extended and filter by a particular Candidate name.
- Position extensions are displayed as separate positions in the Position Summary report.
Credentials
- Credential Expiry shows:
- All credentials that are expired or will expire during a Candidate’s position time based on the applied filtering.
- Expiring or expired credentials which have an updated/renewed credential that does not have a gap in dates between the expiring credential and the new one. If there is a gap in days, then the credential will be included in this report.
- OPD Credential Expiry: shows information about credentials expiration for the Open Per Diem orders only, based on the applied filtering.
- Credential Summary: shows the following credentials information within the specified date range based on the applied filtering:
- Which credential details need to be followed up with the corresponding Agency(ies).
- Which credentials are required for a specific position.
- Which credentials are active/missing/expired for a specific position.
- Which credentials have not been reviewed yet for a specific position.
- Whether there is any credential document not uploaded for a specific position, etc.
- Credential Summary Review Report: Shows position-wise information about the credentials based on the applied filters. It provides a summarized view of the Credential Summary report.
- OPD Credential Summary: shows overall information about credentials for the Open Per Diem orders only, based on the applied filtering.
- Missing Credentials: shows missing credentials only for Candidates in the Accepted and Onboard statuses. It includes required credentials with a toggle to include or exclude optional credentials in the report.
- OPD Missing Credentials: shows information about missing credentials for the Open Per Diem orders only, based on the applied filtering.
Timesheets
- Financial Timesheet shows:
- The details about Candidates' timesheets as per each of their Filled or Closed positions for the specified date range based on the applied filtering. This report includes invoice information if a timesheet has been invoiced but may not reconcile to an invoice total because this report will only reflect timesheet information, no manual invoice detail is included.
- The last modified by person and date for both the timesheet and invoice.
- Timesheet Report: shows details about Candidate(s)’ timesheets of the specific status and for the specified date range based on the applied filtering; this report includes specific clock-in and clock-out times.
- Predicted Contract Labor Spend: shows the forecast of the labor costs for future days/weeks with the help of filled positions (with specific skills) over a certain period based on the applied filtering.
- Department Spend & Hours Report: shows the total invoice amount and total hours that a filtered department(s) has spent with respect to each skill during a specific period.
- This report is based on the approved timesheet service rate (including timesheets, miles, and expenses).
Invoices/Financials
- Invoice Summary: shows invoice details of the Candidates within your Organization for the specified date range based on the applied filtering.
- VMS Invoice Report: shows details about Candidate’s invoices from the Organization’s perspective for the specified invoice generation period based on the applied filtering. This report will align with invoice totals and the file sent through to the AP team.
- Accrual: shows details about timesheets and invoice amounts within the specified date range based on the applied filtering. You can also filter by specific Candidate or position and select to display data by timesheet or by invoice.
You can switch to view more specific reports by selecting the following options from the Go To dropdown menu on the rightmost of the page (Hide the imageSee the image):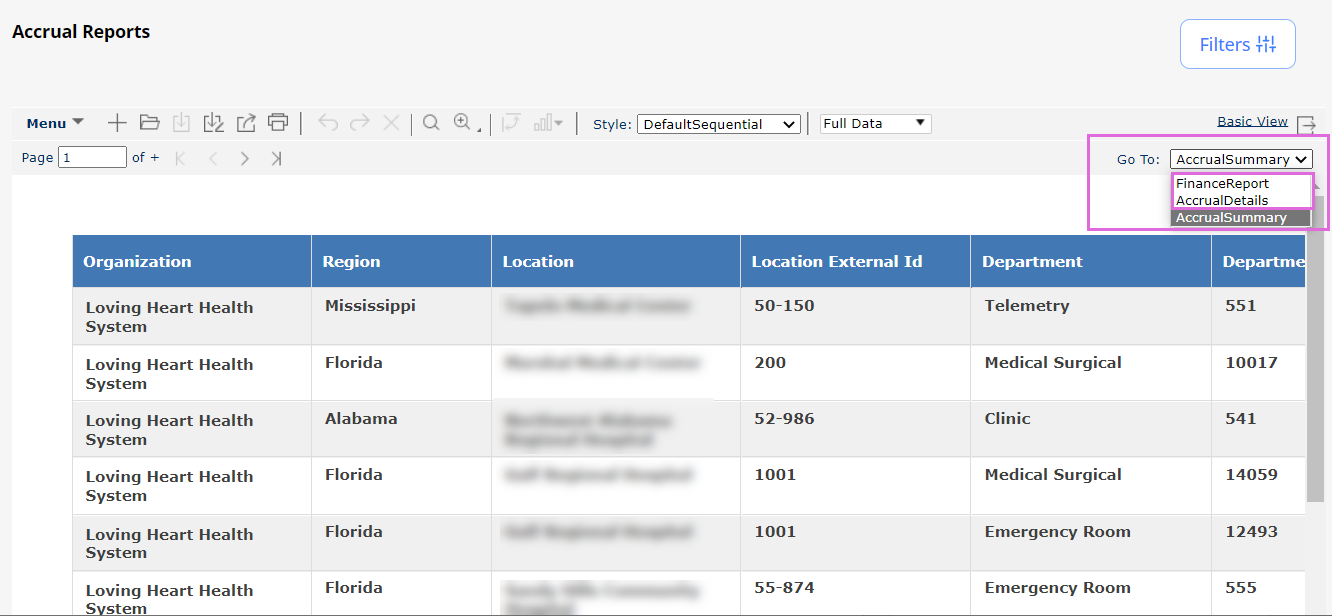
- YTD Summary : shows your Organization's labor spend for a specified month or a whole year based on the applied filtering.
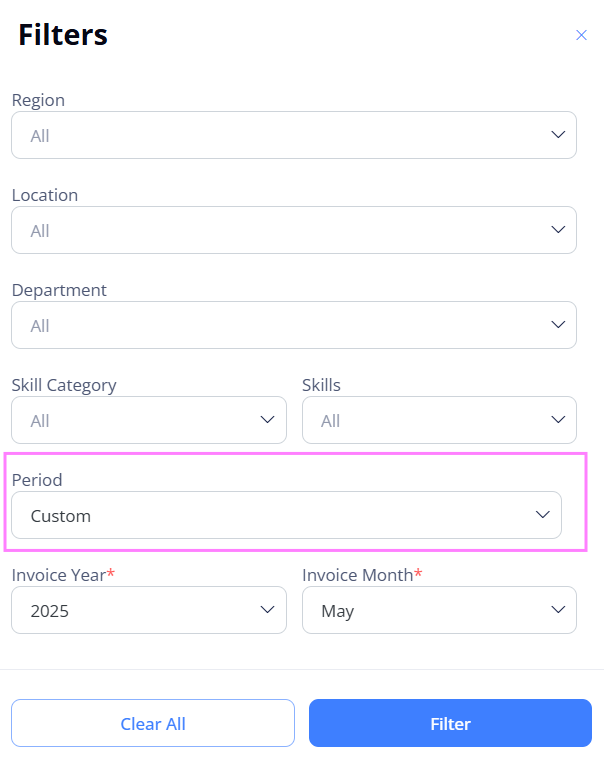
- Use Period dropdown option (See the imageSee the image) in Filters to load the report for a specific period. You can select any one of the below options.
- Custom - Report for selected Invoice Year and Invoice Month. This option works with all filters.
- Year to Last Month - Report from the beginning of the current year to the last month (based on the current date). This option works with all other filters except for the Invoice Year and Invoice Month.
- Year to Current Month - Report from the beginning of the current year to the current month (based on the current date).This option works with all other filters except for the Invoice Year and Invoice Month.
You can also switch to view more specific reports by selecting the following options from the Go To dropdown menu on the rightmost of the page:- YTD Vendor Summary
- YTD Details
- Spend By Month.
Hide the imageSee the image.
- Use Period dropdown option (See the imageSee the image) in Filters to load the report for a specific period. You can select any one of the below options.
- Finance Medicare Wage Report: shows the vendor and cost calculation of an invoice based on the applied filtering.
- Grant Report: shows the vendor, invoice, and timesheet details based on the applied filtering.
- YTD Report: shows the invoiced amount and paid amount throughout the year for your Organization based on the applied filtering.
You can view the YTD Report by Month or YTD Report by Location by selecting the corresponding option from the Go To dropdown menu on the rightmost of the page. Hide the imageSee the image
Vendor
- Vendor Scorecard: shows performance details and an overall score of the associated Agencies based on the applied filtering.
You can select to view this report in the form of a table or graph by selecting the corresponding option (Vendor Scorecard/Vendor Scorecard Graph) from the Go To dropdown menu on the rightmost of the page.
Each generated graph represents a separate Agency (if multiple ones are selected.)
This report shows analytics around the following areas with a detailed description below:Qualified Candidates Candidates who applied between or equal to the selected date range filters. Count of Candidates in Applied, Shortlisted, Custom, Offered, Accepted, Onboard, Offboarded, and Cancelled statuses.
Includes Rejected Candidates with the following exceptions:
Rejected due to: Failed Credentials, Candidate not qualified, Management passed, Candidate Failed Compliance.Total Candidates Candidates who applied between or equal to the selected date range filters. Completed Credentials Orders (positions) with Actual Start Date between or equal to the filters. Within these orders whose positions are in the status Accepted, Onboard, and Offboard.
Then count of Candidate's credentials with the status as Verified, Reviewed, and Completed wich are required for this order.Total Credentials Orders (positions) with Actual Start Date between or equal to the filters. The sum of required credentials for each position whose status is in Accepted, Onboard, and Offboard. Filled Positions Consider all the orders (positions) distributed between or equal to the selected date range filters. Within these orders, we need to consider Accepted, Onboard, and Offboard positions for the count. Total Positions Consider all the orders (Positions) distributed between or equal to the selected date range filters. Within these orders, we need to consider all the positions distributed. Value Add Submissions Consider all (In Progress & Filled & Closed) orders whose start date is falling between or equal to the selected date range. Total Submissions Consider all (In Progress & Filled & Closed) orders whose start date is falling between or equal to the selected date range.
Count of all Candidates in Applied and above status, including Cancelled Candidates + all Rejected Candidates.On Time Start Consider all orders whose start date is falling between or equal to the selected date range.
From these orders, we take the count of positions with the Accepted, Onboard, and Offboard statuses whose Actual Start Date matches Offered Start Date.Filled Positions Consider all orders whose start date is falling between or equal to the selected date range.
From these orders, we take the count of positions with the Accepted, Onboard, and Offboard statuses. Cancelled positions to be considered.Candidates Onboarded Consider all orders whose Actual Start Date is falling between or equal to the selected date range. Within those orders all the Candidates who moved from Accepted to Onboard & Offboard within the filter dates. Total Accepted Offers Consider all orders whose Actual Start Date is falling between or equal to the selected date range. Within those orders count of all the Candidates who accepted offers within the filter dates. Contract Termination Within or equal to the selected date filters, Candidates who were in Onboard and moved to Cancelled status. Onboard Positions Within or equal to the selected date filters, count of all the Candidates who were in Onboard, Onboard to Cancelled, and Onboard to Offboard statuses. Positions Distributed Distribution date in-between or equal to the date filters, consider the count of total positions in all the orders distributed within or equal to the timeframe. Time to Submit Distribution date in-between or equal to the date filters and the average time an Agency takes to submit a Candidate. Time to Start Actual Start Date is in-between or equal to the date filters.
Average of all positions from distributed date to positions' Actual Start Date that includes Cancelled Candidates.- Submission Quality - Compliance Rating - Fill Rate - Cost Adjustment
- On Time Start - Candidate Starts - Candidates Remaining on Assignment
- Orders Distributed within Filter Timeframe - Time to Submit
- Time to Start - Average Overall Rating
- Vendor Activity: shows the number of Candidates submitted to orders per Agency within the specified date range based on the applied filtering.
- Performance Vendor Scorecard: shows performance details of the associated Agencies based on the applied filtering.
- The report considers all types of LTA orders, Contract To Perm orders, and Re-orders.
Select the Start Date, End Date, and Agency, then click Submit to filter the report . Select the Export to Excel icon to download the report as an Excel file.
This report shows analytics around the following areas with a detailed description below:
- Performance Metrics is calculated as the sum of 40% of TOA (Travellers on Assignment) %, 20% of the Total number of orders filled in 14 days or less %, 20% of the Starts Within 14 Days of Acceptance %, and 20% of the On Time Starts %.
Agency Travellers on Assignment Count all (Onboard, Onboard to Cancelled, Onboard to Offboard) positions in the agency whose actual start date falls on or within the selected date range for that agency.
Total Travellers on Assignment Count all (Onboard, Onboard to Cancelled, Onboard to Offboard) positions in the organization whose actual start date falls on or within the selected date range for that agency.
TOA (Travellers on Assignment) % Shows the percentage of Agency Travellers on Assignment among Total Travellers on Assignment.
Accepted within 14 Days
Within or on the selected date range, count all (Accepted, Accepted to Rejected) positions where the accepted date falls within 14 days of the agency’s distribution date.
Total Accepted Count all (Accepted, Accepted to Rejected) positions within or on the selected date range.
Total number of orders filled in 14 days or less % Shows the percentage of position Accepted within 14 days among Total Accepted position.
Starts within 14 Days of Acceptance Within or on the selected date range, count all positions with the candidate statuses of Onboard, Cancelled, and Offboard, whose actual start date falls within 14 days of the accepted date.
Total Starts Count all positions with the candidate statuses of Onboard, Cancelled, and Offboard, whose actual start date falls within the selected date range.
Starts Within 14 Days of Acceptance % Shows the percentage of position starts within 14 days of Acceptance among Total Starts.
On Time Starts Within the selected date range, count all positions with candidate statuses of Onboard, Cancelled, and Offboard, whose actual start date is less than or equal to the offered start date.
Total Starts Count all positions with candidate statuses of Onboard, Cancelled, and Offboard, whose actual start date falls within the selected date range.
On Time Starts % Shows the percentage of On Time Starts position among Total Starts position.
- Quality Metrics is calculated as the sum of 50% of the Submission Quality % and 50% of the Contract Completion %.
Qualified Candidates Count the rejected candidates based on specific reason codes and the candidates with statuses of Applied, Shortlisted, Custom, Offered, Accepted, Onboarded, Offboarded, or Cancelled, who applied within or on the selected date range.
Total Candidates Count all rejected candidates and candidates with statuses of Applied, Shortlisted, Custom, Offered, Accepted, Onboarded, Offboarded, or Cancelled, who applied within or on the selected date range.
Submission Quality % Show the percentage of Qualified Candidates among the Total Candidates.
Contract Completion Count all positions with statuses of Onboarded or Offboarded, where the actual end date falls within or is equal to the selected date range.
Total Completed Assignments Count all positions with statuses of Onboarded, Offboarded, or Cancelled, where the actual end date falls within or is equal to the selected date range.
Contract Completion % Shows the percentage of Contract Completion among the Total Completed Assignments.
- Overall Performance is calculated as the average of Performance Metrics and Quality Metrics.
Time to Submit Average number of days taken for the positions from the distribution date to the applied date, considering all positions distributed to the agency with candidates having Applied or higher statuses (including Rejected and Withdrawn) within the selected date range.
Time to Offer Average number of days taken for the positions from the applied date to the offered date, considering all positions offered to the agency with candidates having Offered or higher statuses (including those rejected after the Offered status) within the selected date range.
Time to Accept Average number of days taken for the positions from the offered date to the accepted date, considering all positions accepted by the agency with candidates having Accepted or higher statuses (including those rejected after the Accepted status) within the selected date range.
Time to Start Average number of days taken for the positions from the accepted date to the actual start date (including Cancelled), considering all positions with an actual start date that falls within or on the selected date range and candidates having Accepted or higher statuses (including Cancelled and Offboarded).
Audit Logs
- User Activity Report: shows the list of activities a logged-in user has performed during a period specified in Filters.
- User Visibility: shows information about the visibility of your Organization's users based on the applied filtering.
Manage reports
Use the options on the report toolbar to manage your reports. Hide the imageSee the image.

- The content in this section references the following source: insightsoftware 2022, Logi Report Server Guide v19.1, < https://pre-bi.einstein2.com/vt/help/userguide/server/content/launch-server-overview.htm >.
Export/print a report
To export a report:
- On the report toolbar, select the export icon
 to open the Export dialog.
 - In the File Name field, enter the file name.
- Specify the destination you want to export the report:
- View Report Result: select to open the report directly in the web browser if the format is supported by a plug-in of the web browser (otherwise, the Server prompts you to save the output file).
- Save to File System: select to save a report to a specified local folder.
- Save to Version System: select if you want to save the report as a result version in Logi Report Server's versioning system.
- From the Select Format dropdown list, select the format in which you want to export the report.
- To specify the additional settings of the selected format, select More Options.
- Select OK to apply the changes and export the report.
To print a report:
- On the report toolbar, select the print icon
 to open the Print dialog.
 - From the Printer dropdown list, select the printer you want to use.
- To specify the printing properties, select the Properties… link.
- You can select the More Settings link to configure additional page properties such as paper size, margins, and others.
- Specify the number of copies, page orientation, and paper type for the printed report file.
- Select OK to print the report.
Schedule a report task
To schedule a report task:
- On the report toolbar, select the quick schedule icon
 to open the Quick Schedule dialog.
 - In the Schedule Name field, enter the name for the task.
- From the Time Type dropdown list, specify when you want to perform the task:
- To perform the task as soon as you submit it, select Immediately.
- If you want to run the task repeatedly, select Periodically, then specify to run it daily, weekly, or monthly at a specified time of the day.
- From the Publish To dropdown list, select where you want to publish the report and then specify the settings of the selected publish type.
- Select OK to submit the task.
Insights
To pull the needed data for your PowerBI reports, in the right side of the page, use the Filter sidebar and make the required selections.
- VMS Spend Report
- VMS Spend by Work Date: Shows the total spend (sum of invoice amounts) based on the work date.
- VMS Spend by Invoice Date: Select Invoice Date tab to view the total spend (sum of invoice amounts) based on the Invoice date.
- VMS Spend by Organization Details: This table shows the organization’s Invoice hours (total worked hours), VMS Spend by Work Date, VMS Spend by Invoice date, Average rate VMS assignments.
- Average rate VMS assignments column shows the average offered bill rate for active VMS contracts, excluding rejected candidates. It includes only contracts that are onboard, offboard or cancelled status and was active at some point within the selected timeframe based on Actual start and end dates.
- Top VMS Spend by Location / Skill: Shows the total invoice amount (VMS Spend by Work Date) for each location.
- Organizational Spend per Agency: Shows the total invoice amount (VMS Spend by Work Date) for each agency.
- Weekly Client Summary
- VMS Weekly Client Positions and Resource Summary – Selected Week: This table shows key organizational metrics for the selected week, including expected working resources, percentage changes over four weeks, staffing activity (unfilled, accepted, onboarded, and active positions), position approval status, RN staffing ratios, average VMS rates, and weekly starts, ends, and resource totals.
- Next 3 Weeks -Starts & Ends: Shows the next 3 weeks’ counts of VMS Starts, VMS Ends, Resources (End of Wk) for the organization.
- VMS Starts column shows the count of VMS position orders that have started, excluding rejected candidates and blank start dates.
- VMS Ends column shows the count of completed VMS position orders, based on actual end dates and excluding rejected candidates.
- Resources (End of Wk) column shows the number of VMS contracts that remain active at the end of the week, excluding rejected candidates.
- Trends: Shows different trend lines such as Working, Starts, Filled, Unfilled, Positions, Pre-Cancel (Default), and Post Cancel with the values.
- Assignments - Weekly
- Assignments and Timesheets: Shows the number of VMS candidates who are actively working or expected to start based off their actual start date, along with the count of unique job assignments with submitted timesheets.
- Current Candidate Assignment Status: This table shows the total number of active VMS job contracts, categorized by candidate status.
- Weekly Summary: This table shows weekly expected resources based off their actual start date (including accepted), timesheet activity, VMS spend, invoiced and pending hours, onboarding, starts, ends, and opened positions.
- Timesheet Hours: This shows the total invoiced hours, approved timesheet hours not yet invoiced, and pending timesheet hours awaiting approval and invoicing.
- Assignment Details: This table shows the order and candidate information, including PID, expected vs. working resources, onboarding details, start and end dates, application status, invoiced and pending hours, offered rate, accepted date, and organizational data such as location, region, and department.
- Order Fulfilment
- Position on Orders: Shows the number of open positions from position orders, open positions by original start date, and VMS position orders that have started.
- Placements / Starts: Shows the total number of started VMS position orders and their distribution by skill category.
- Job Order Summary: This table shows the quarterly position order summary, including VMS starts, position metrics, program fill rate, on-time start %, average rates, and key lifecycle time intervals from order creation to onboarding.
- Order Fill Rate Definition: Percent of positions within an order that were filled measured over a timeframe. The measure includes orders with an order start date with at least one position that made it to at least the accepted stage during the same selected timeframe. The denominator includes total positions on those qualifying orders and the numerator includes the assignments started from those orders (Candidate Status of Onboard, Cancelled, or Offboard). This measurement excludes any orders that were ultimately unfilled in any capacity.
- On Time Start % Definition: Number of actual starts (candidate status Onboard, Offboard, or Cancelled) with on time start, divided by total people that actually started (candidate status Onboard, Offboard, or Cancelled). An assignment is considered on time if the Candidate has an Actual Start Date before or equal to the Offered Start Date.
- Avg Rate (Nursing Only) Definition: Avg Rate for Active Assignments for Nursing Skill Category (based on system category).
- Avg Rate Assignment Starts (Nursing Only) Definition: Avg Rate for New Assignment Starts for Nursing Skill Category (based on system category).
- Average Days between Job Milestones: Specific milestones in candidate job orders can be measured by calculating the average time elapsed between two dates. Averages of the key milestone dates for candidate jobs are defined below.
- Days to Fill: Average days between Order Open Date to Candidate Accepted Date.
- Job Order Details: This table shows detailed order and candidate information, including order and position data, skill details, candidate statuses and timelines, start/end dates, order status, agency and organizational info, and key lifecycle metrics such as applied-to-offered and accepted-to-onboarded
- Invoices
- VMS Spend by Invoice Date and Invoice Type: Shows VMS spend by invoice date, showing total spend, positive (debits) amounts, and negative (credits) separately.
- Avg Days from Worked to Invoiced / Paid: This shows the average time from work date to invoice date, and from invoice issuance to payment.
- VMS Spend by Date Worked and Invoiced: This table shows total invoice amounts by both invoice date and worked date.
- Unpaid Invoices by Invoice Age in Days: Shows the total unpaid invoice amounts and the number of days since invoice was generated.
- Unpaid Invoices by Invoice Date and Status: This table shows the organization’s total unpaid invoice amounts, from Submitted to Pending Approval status.
- VMS Skill and Rates
- VMS Working Resources by Skill Group: Shows the count of VMS candidates who have worked or are expected to start in each skill category.
- Rates and Spend - (Region, State, Organization, Skill): Shows invoice hours, VMS spend (by work date), average VMS rate, and active resources by region (can also view by state, organization, or skill category).
- Map: Shows state-wise geographical view with colour codes for the average offered bill rate of active VMS contracts, total invoice amount by work date, and the count of VMS candidates currently working or expected to start.
- Avg Rate VMS: Shows the average offered bill rate for active VMS contracts in each skill group category.
- Rates Dashboard
- Avg Rate VMS Assignments: Shows the average offered bill rate for active VMS contracts, excluding rejected candidates. It includes only contracts that are onboard, offboard or cancelled status and was active at some point within the selected timeframe currently active based on Actual start and end dates.
- Avg Rate VMS Assignment Starts: Shows the average offered bill rate for VMS candidates who have started in each skill category.
- Avg VMS Weighted Rate: Shows the average hourly rate from timesheets in each skill category.
- Assignments and Starts: Shows the count of VMS candidates who have started working, as well as those currently working or expected to start.
- Assignment Rate Details: This table shows skills, orders, VMS starts, active workers within the selected timeframe, actual start and end dates, offered bill rates, skill categories, and location details.
- Agencies
- Program Placements / Starts: Shows the count of VMS position orders that have started for each agency.
- Submissions and Placements / Starts: Shows the number of job submissions and VMS job starts, grouped by their applied dates.
- Agency Job Order Summary: This table shows, for each agency and, key metrics including submissions, program starts, rejections, offers, cancellations, on-time start %, average VMS start rates, lifecycle averages, VMS spend, and cancellations before and after start.
- IRP Order Fulfilment
-
IRP Positions on Orders: This chart provides insights into IRP positions and starts using three key measures
-
Positions by IRP Order Open shows the total open positions based on the IRP Order Open Date.
-
Positions by Initial Order Start shows the total open positions based on the Original Start Date.
-
IRP Starts counts the number of IRP positions that have actually started, excluding rejected or cancelled orders.
-
IRP Placements/Starts: Counts all IRP positions that have actually started, excluding rejected or cancelled orders. It uses the Actual Start Date for time-based analysis.
-
IRP Job Order Summary: This table shows key metrics for LTA, Per Diem, and Total Orders, including cycle times (open-to-applied, applied-to-onboard), positions by order dates, IRP starts, fill rate, and on-time start percentage.
-
IRP Job Order Details: This table shows detailed order information, including order details, position data, job and candidate status, start and end dates, cycle times, performance metrics, and reasons for cancellations or rejections.
-
- IRP Assignments
-
IRP Weekly Assignments: Shows weekly counts of distinct IRP job orders actively assigned within the selected date range, excluding withdrawn, rejected, or cancelled orders for different skill categories. It includes positions with valid start and end dates.
-
IRP Current Assignment Status: This table shows IRP Assignment counts, which represent the distinct IRP job orders actively assigned within the selected date range. Withdrawn, rejected, or cancelled orders are excluded, and only positions with valid start and end dates are considered. The data is shown by skill category for all organizations and candidate job statuses.
-
IRP Weekly Summary: This table shows weekly counts of assignments, LTA resources working, per diem, onboarded, start, end, and open positions.
-
IRP Scheduled Hours: Shows the week-wise sum of scheduled hours.
-
IRP Assignment Details: This table shows order details including job IDs, IRP resources, onboarded counts, candidate status, dates, order type, and organizational information.
-